Analyzing Storage Performance Data & Generating Graphs with Xperf
Xperf is one of Microsoft’s hottest diagnostic tools. It collects event trace information from components of the operating system and then displays the data in a graphical format.
Powerful graph options allow you to quickly pinpoint any storage bottlenecks, along with the detailed data in a tabular format. This article continues where Xperf Rocks Part 1: Troubleshooting Storage Performance Problems left off. It discusses how to use Xperf to analyze event data and generate graphs and tables.
Gain Visibility into Storage Performance & SAN Slowdowns
SolarWinds Free SAN Monitor allows you to Monitor Dell®, IBM®, & Sun® StorageTek™ Storage Arrays:
- Quickly and easily monitor popular storage arrays, with support for Dell® MD3000 Series; IBM® DS3000, DS4000, & DS5000 Series; & Sun® StorageTek™ 2000 & 6000 Series
- Gain at-a-glance insight into real-time storage performance & capacity with a slick desktop dashboard
- Drill into LUN inventory details including: LUN size, physical disks, RAID type, total IOPs, IO response time, & more.
Download FREE SAN Monitor here »
Xperf Viewer
In the previous Xperf article (part 1), we learned how Xperf is installed and used to collect event trace logs (ETLs). These trace logs contain data that characterizes the problem. The ETL data can be analyzed on the problem system or it can be copied to another workstation where WPT is installed.
The following Xperf command will analyze the data and then use Xperfview.exe to generate graphs and tables:
Xperf tracedata.etl
As the Xperf tool parses the ETL log file, it performs 2 passes at analyzing the data. Once the data is analyzed, Xperf displays a viewer that you can use to study the various graphs. Of particular concern for a storage bottleneck, you would want to focus on the Disk Utilization and the Disk Utilization by Process graphs. In figure 1 below, you can see the Disk I/O graph displays the various I/O counts for read and write operations. Xperf also shows an expandable frame on the left-hand side allowing you to quickly switch between the different graphs.
Figure 1 (above): Xperf Disk I/O graphs illustrates Read and Write counts
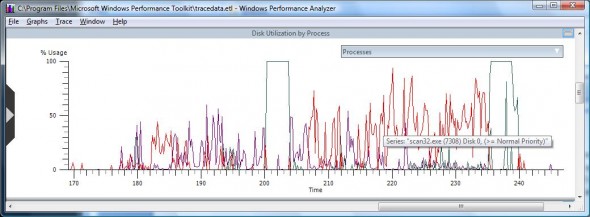
Each graph will reveal more detailed information as you hover the mouse cursor over a particular spot on the graph. In figure 2 below, you can see how the scan32.exe process is exposed in the following Disk Utilization by Process graph when the mouse is positioned over the red line.
Figure 2 (above): Xperf Disk Utilization by Process graph expands details by hovering mouse cursor over graph
You can quickly zoom in on a particular area of the graph to get more granularity on the performance counters or events. To do so, simply left-click and drag over the portion of the graph you are interested in, and then right-click to select “Zoom To Selection” as seen in figure 3 below. This will create a new graph that is focused on the region of time you selected. To unzoom the graph, just right-click anywhere on the graph and choose Unzoom.
Similar Posts:
- Sysinternals Tools Updated: ProcMon 3.0 released
- VDI + Windows PageFile Done Right!
- Skimming a Hyper-V Service Event log with PowerShell
- Lakeside Software and Atlantis Computing Team Up
- Top 10 Reasons You Need To Be Using Windows Intune

